Archive
Bathurst Metals Corp. 2021 McGregor Lake and Speers Lake Assay Results
 | |||||||||
 |  | ||||||||
Vancouver, British Columbia - TheNewswire - January 13, 2022 - Bathurst Metal Corp. (TSXV:BMV) (OTC:BMVVF) (“Bathurst” or the “Company”) is pleased to announce the company has received final assay results from the summer 2021 field exploration work on the Copper/Nickel/Cobalt/Palladium/Platinum McGregor Lake and Speers Lake properties in western Nunavut. The Company’s 100% owned property consists of 12 mineral claims covering 14,584.24 hectares. The properties are approximately 100 km south of Kugluktuk in the Kitikmeot District of western Nunavut, Canada. These properties are considered to host layered disseminated to semi-massive sulphide primary mineralization and secondarily, structurally controlled, massive sulphides.
Rock sampling some of the numerous gossans along the contact of a Proterozoic, ultramafic intrusive with Archean Age, metasediments has located high-grade copper, nickel and Palladium mineralization. As well, high concentrations of cobalt and platinum were also obtained. Highlights of Assay Results from the 2021 Summer Program from each area examined are enclosed below in Table # 1. Tables of each of the areas sampled and mapped are also posted within this release.
Table # 1 Highlights of Assay Results
|
Sample |
Area |
Cu % |
Ni % |
Co ppm |
Pt ppm |
Pd ppm |
|
V996601 |
Speers Lake |
1.55 |
0.57 |
589 |
0.53 |
1.1 |
|
V996619 |
E. Pump Lake |
15.40 |
5.90 |
1550 |
0.69 |
11.8 |
|
V996621 |
E. Pump Lake |
11.50 |
0.08 |
32.6 |
4.06 |
44.5 |
|
V996674 |
West Margin |
5.66 |
0.02 |
24.9 |
0.15 |
4.18 |
|
V996670 |
Funnel |
2.98 |
0.08 |
41.6 |
0.05 |
6.42 |
|
V996663 |
South Pyrrhotite Lake |
2.38 |
0.85 |
1440 |
0.01 |
0.68 |
|
V996653 |
Val |
0.90 |
0.63 |
871 |
0.01 |
0.06 |
Hardy Forzley, Chief Executive Officer of Bathurst Metals commented: “Our geological staff was able to confirm historical results but more importantly advance the structural setting of the known higher-grade mineralization. These properties have geological, structural and mineralogical similarities to and scale of the world class Norilsk-Talnakh deposits in northern Russia.”
The purpose of the 2021 summer exploration program was to enable Bathurst to better understand the project’s potential economics by undertaking structural mapping on cross cutting Proterozoic Age structures, the company employed three senior geologists to work on the project including Dr. Guowei Zhang, Ph.D., P.Geo. specialist in structural analysis. The team performed geologic mapping of potential favorable host basement assemblages, located historic drill hole collar locations and systematically sampled mineralization along the Archean basement and ultramafic intrusive complex contact. Based on the 2021 results, the company is evaluating the use of additional geophysical techniques to further develop the structural setting of mineralization prior to drilling.
Discussion on 2021 Program Results
Dr. Zhang was able to locate steeply dipping, generally east-west trending structures in the areas of known higher grade copper/nickel/cobalt/platinum and palladium mineralization. These structures are interpreted to be conduits for the remobilization of the mineralization and subsequent entrapment along the Proterozoic, ultramafic intrusive/Archean Age, metasedimentary contact.
Previous work and Dr. Zhang’s recent studies support the concept that the property shares a similar scale, geology and known mineralization style to the Norilsk-Talnakh in northern Russia, the largest-known nickel-copper-palladium deposit in the world. The two main ore types developed at Norilsk and Talnakh are disseminated sulphides within the differentiated gabbro-dolerite sills, principally on the lower margins of the mineralized zone where they occur as droplets forming sheet like conformable bodies up to 40 m thick. Grades there average 0.5 to 0.6% Ni, 0.6 to 0.7% Cu, and 5 to 6 g/t PGE. Secondly, there are massive sulphides found principally on the lower contact of the mineralized sills, both within the enclosing rocks and to a lesser degree within the sill and are often separated from the sill by several metres of barren sediment or cupriferous mineralization. Sometimes massive sulfides are also found on the upper margin of the sill. In other locations the massive sulphides cut across the sill to its upper margins. Grades vary drastically with the sulphide assemblage but are of the order of 2.8% Ni, 5.6% Cu and 15 g/t PGE. At Norilsk there is evidence that the massive sulphides post date the disseminated sulphides. The total production + resource in the Noril'sk-Talnakh district are quoted by Naldrett (2004) at: 1.309 Gt @ 1.77% Ni, 3.57% Cu, 0.061% Co, 9.5 g/t PGE (including 1.84 g/t Pt, 7.31 g/t Pd).
The Company’s 2021 assay results confirmed historic results and a significant number of historic drill collars were located and surveyed.
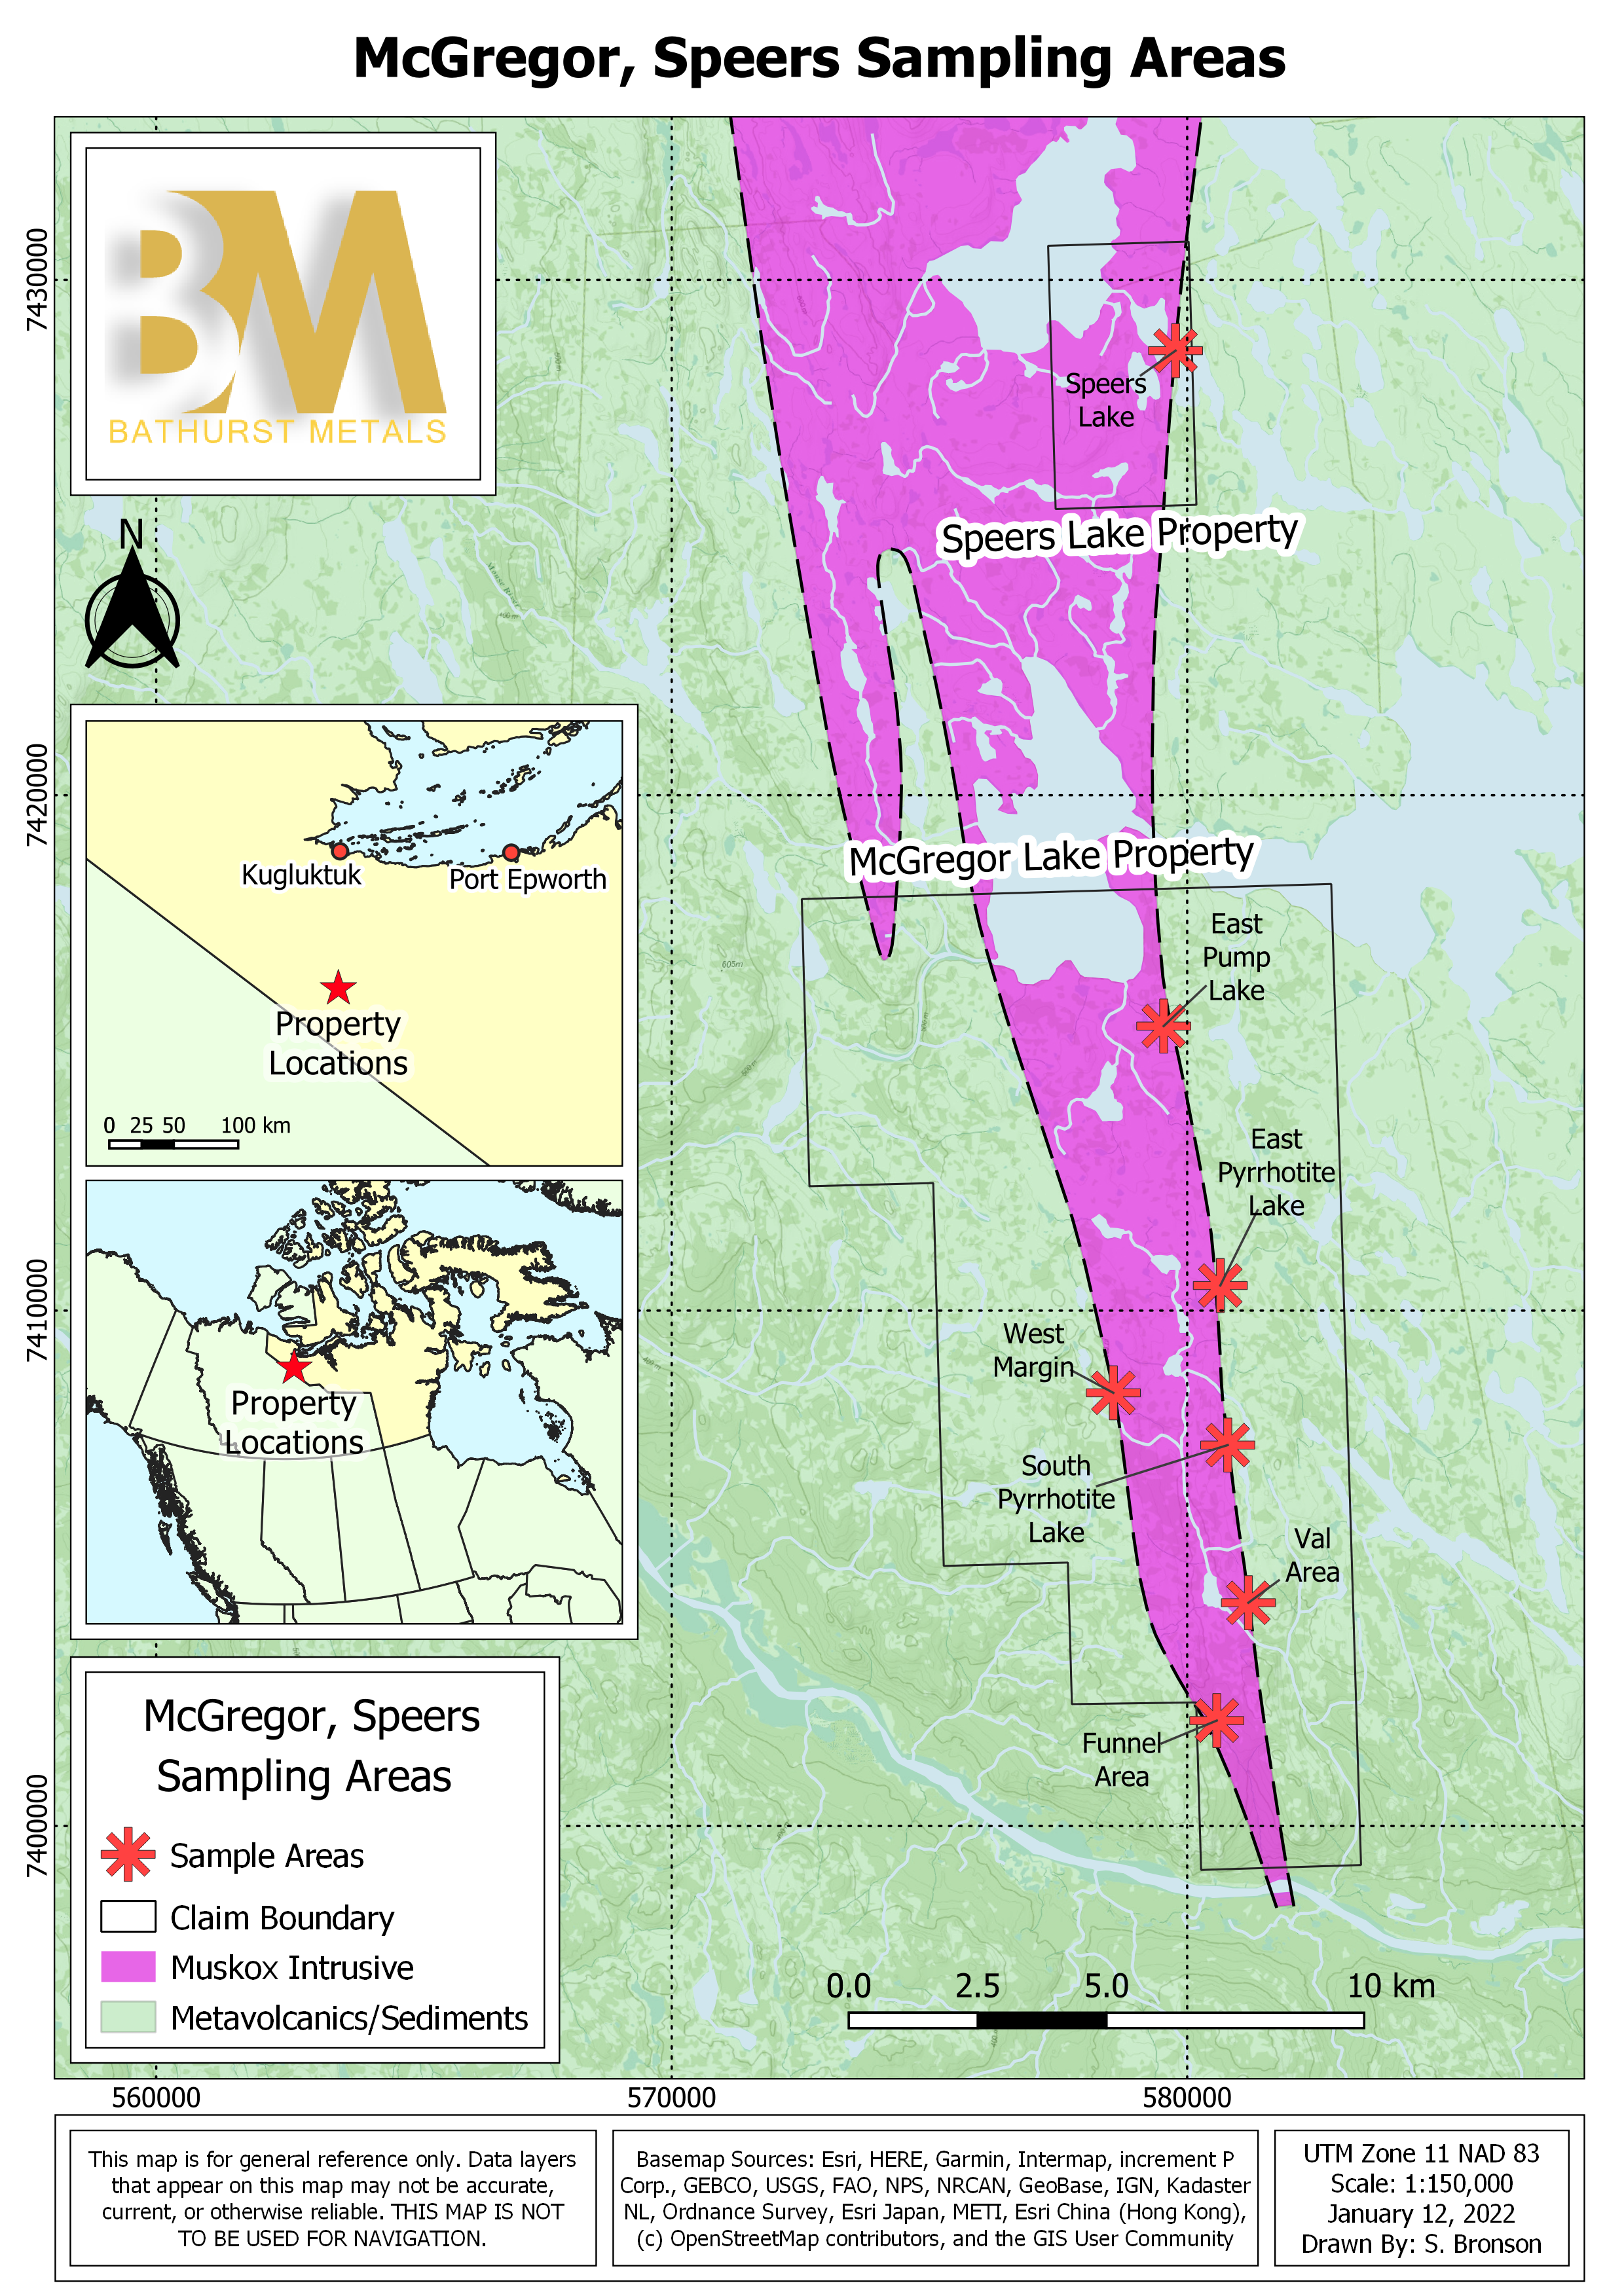
The enclosed Figure # 1 diagram outlines the areas rock sampled and structurally mapped during the 2021 field season. These areas were selected based on historical assay results and the outcrop exposures enabling the structural studies.
Figure # 1 – Location Map of Areas Sampled
Click Image To View Full Size
Discussion on Areas Sampled
Speers Lake Area
Sampling was restricted to outcrops along the ultramafic intrusive/meta-sediment contact as most of the intrusive does not outcrop. Sampling consisted of grab samples where mineralization was observed. Not previously recorded are the high concentrations of cobalt associated with the copper and nickel mineralization. Table # 2 lists the grab sample results from the 2021 program.
Table # 2 Speers Lake – 2021 Rock Sample Results
|
Sample |
UTM E |
UTM N |
Cu % |
Ni % |
Co ppm |
Pt ppm |
Pd ppm |
|
V996601 |
579668 |
7428454 |
1.55 |
0.57 |
589 |
0.53 |
1.1 |
|
V996602 |
579666 |
7428462 |
0.95 |
0.38 |
277 |
0.11 |
1.04 |
|
V996603 |
579739 |
7428126 |
0.94 |
0.34 |
1100 |
0.01 |
0.11 |
|
V996604 |
579678 |
7428405 |
0.59 |
0.30 |
591 |
0.04 |
0.15 |
|
V996605 |
579747 |
7428245 |
0.07 |
0.04 |
71.3 |
0.01 |
0.06 |
|
V996606 |
579738 |
7428659 |
0.90 |
0.62 |
1020 |
0.01 |
0.61 |
|
V996607 |
579738 |
7428784 |
0.91 |
0.36 |
398 |
0.04 |
0.33 |
|
V996608 |
579737 |
7428810 |
0.30 |
0.09 |
125 |
0.03 |
0.13 |
|
V996609 |
579746 |
7428999 |
0.66 |
0.32 |
718 |
<0.01 |
0.14 |
|
V996610 |
579747 |
7429015 |
0.29 |
0.11 |
251 |
0.01 |
0.06 |
|
V996611 |
579758 |
7430134 |
0.09 |
0.14 |
111.5 |
0.02 |
0.07 |
|
V996612 |
579749 |
7430144 |
1.08 |
0.89 |
1665 |
<0.01 |
0.31 |
|
V996613 |
579734 |
7430126 |
0.17 |
0.17 |
148.5 |
0.04 |
0.13 |
Listed below are some of the more significant precious and base metal assay results from historical geochemical rock sampling and diamond drilling.
Historical Rock Geochemistry – Grab Samples
|
Pt |
Pd |
Au |
Cu |
Ni |
|
(g/tonne) |
(g/tonne) |
(g/tonne) |
(%) |
(%) |
|
0.87 |
5.48 |
5.0 |
3.50 |
0.18 |
|
2.55 |
3.43 |
2.0 |
0.45 |
0.24 |
Historical Diamond Drilling – Diamond Drill Hole 87-S10 Assay Results
|
FROM |
TO |
THICKNESS |
Pt |
Pd |
Au |
Cu |
Ni |
|
(m) |
(m) |
(m) |
(g/tonne) |
(g/tonne) |
(g/tonne) |
(%) |
(%) |
|
94.40 |
95.10 |
0.70 |
1.94 |
38.45 |
6.03 |
1.18 |
3.89 |
|
107.23 |
107.63 |
0.40 |
5.57 |
52.71 |
1.41 |
0.22 |
3.79 |
*Thickness is core length; true width is unknown.
Figure # 2 provides the historic surface sample locations and results and shows the company’s current mineral claims.
Figure # 2 Historic Pt+Pd+Au Rock Sample Results on McGregor Lake Property
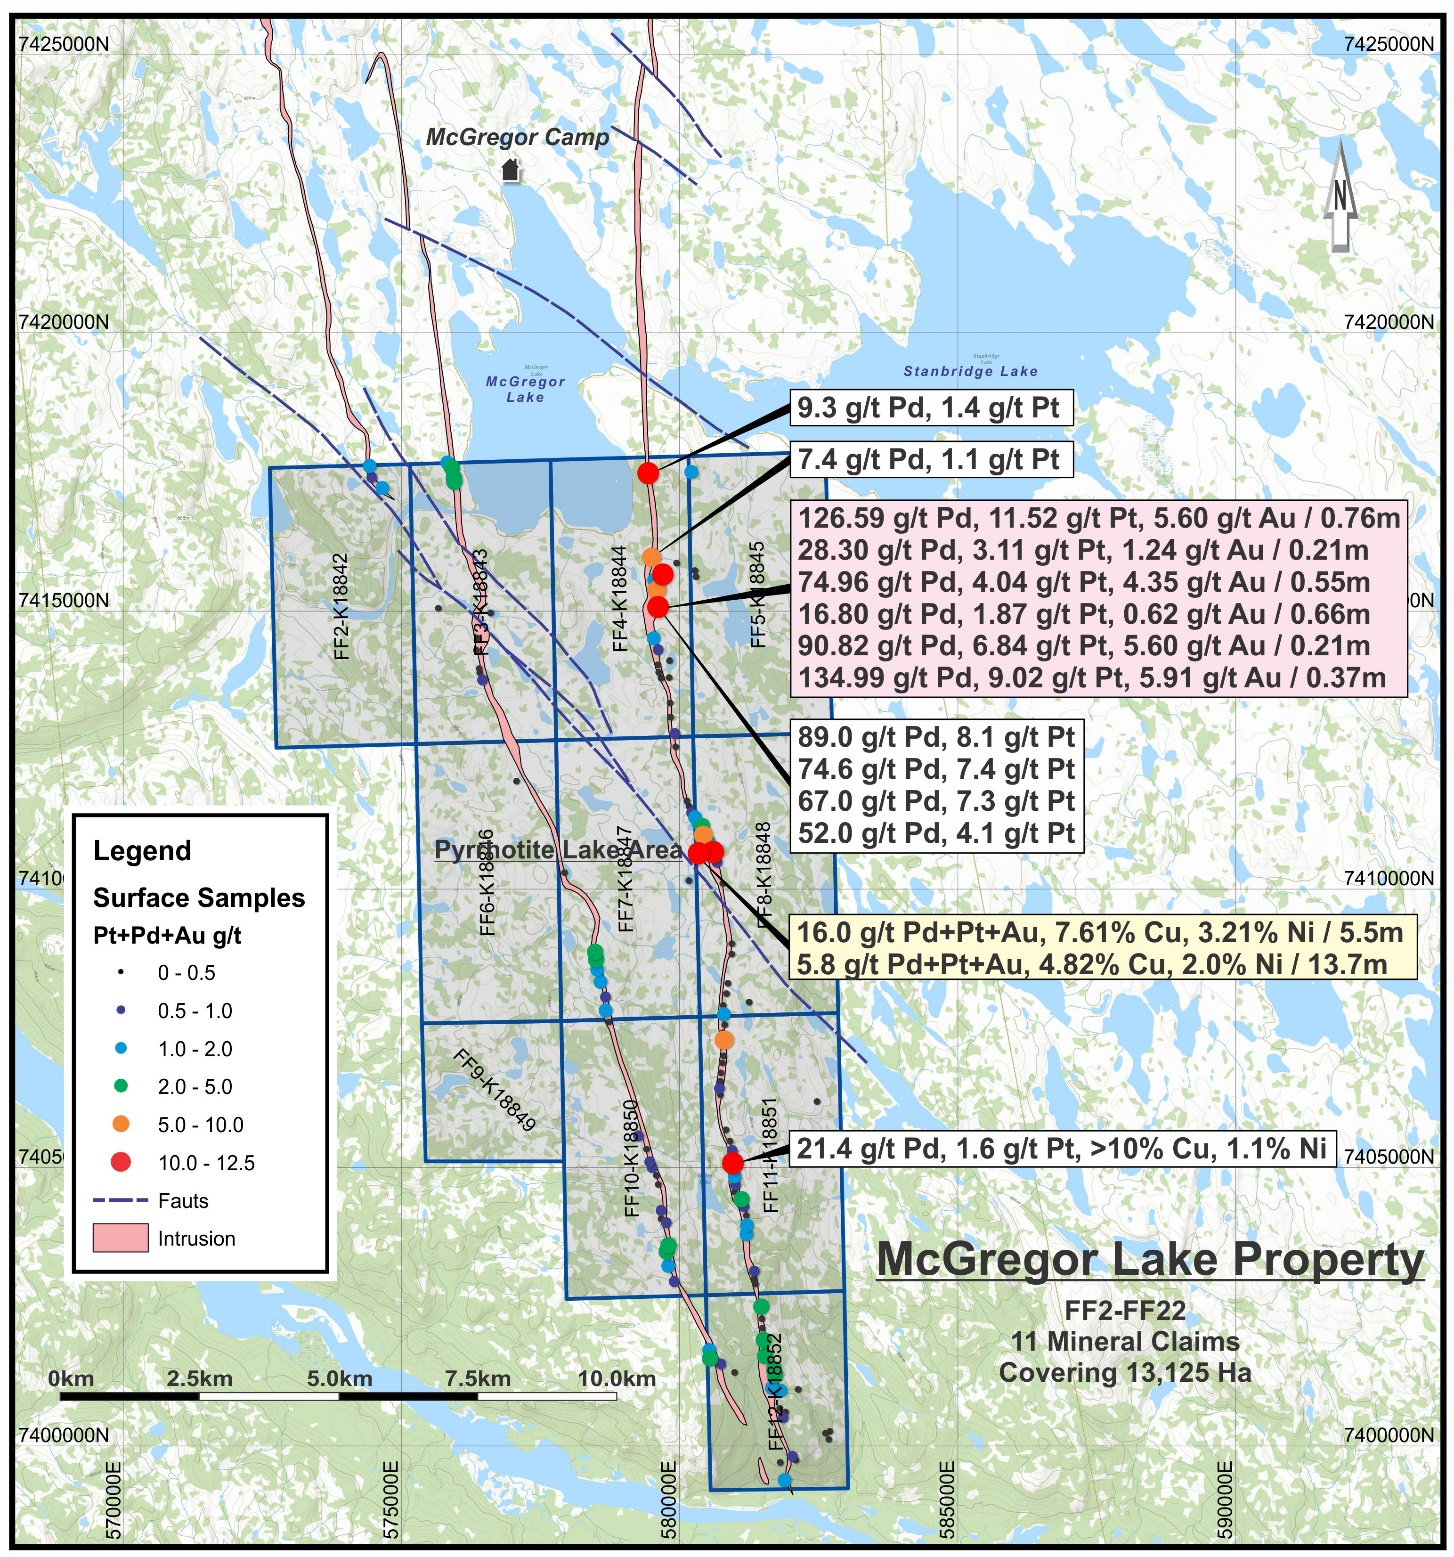
Click Image To View Full Size
*Thickness is core or chip sample length; true width is unknown.
Tables 3 to 8 below outline all the samples collected in 2021 from the East Pump Lake, West Margin, Funnel, South Pyrrhotite Lake, East Pyrrhotite Lake and Vale Areas respectively. These areas are outlined in Figure #1. Assay results from these tables indicate a positive correlation between Nickel and Cobalt and Palladium with Copper.
Table # 3 - East Pump Lake
|
Sample |
UTM E |
UTM N |
Cu % |
Ni % |
Co ppm |
Pt ppm |
Pd ppm |
|
V996614 |
579531 |
7416049 |
0.32 |
0.21 |
117 |
0.01 |
0.2 |
|
V996615 |
579542 |
7416011 |
3.23 |
0.41 |
317 |
0.07 |
2.09 |
|
V996616 |
579540 |
7416012 |
1.78 |
0.20 |
157 |
0.07 |
0.63 |
|
V996617 |
579551 |
7415964 |
1.19 |
0.05 |
31.7 |
0.19 |
1.84 |
|
V996618 |
579553 |
7415966 |
0.19 |
0.01 |
4.1 |
<0.01 |
0.02 |
|
V996619 |
579551 |
7415965 |
15.40 |
5.90 |
1550 |
0.69 |
11.8 |
|
V996620 |
579557 |
7415910 |
0.15 |
0.09 |
156 |
<0.01 |
0.11 |
|
V996621 |
579486 |
7415682 |
1.66 |
1.19 |
1270 |
0.01 |
0.19 |
|
V996622 |
579531 |
7415631 |
0.32 |
0.03 |
21.6 |
0.03 |
0.76 |
|
V996623 |
579541 |
7415616 |
0.12 |
0.02 |
24.2 |
0.01 |
0.2 |
|
V996624 |
579531 |
7415582 |
0.40 |
0.27 |
227 |
0.06 |
0.68 |
|
V996625 |
579532 |
7415577 |
0.81 |
0.34 |
349 |
0.02 |
0.67 |
|
V996626 |
579544 |
741523 |
6.15 |
0.04 |
45.3 |
0.05 |
0.73 |
|
V996627 |
579561 |
7415474 |
0.46 |
0.05 |
1090 |
0.09 |
0.17 |
|
V996628 |
579524 |
7415516 |
0.61 |
0.99 |
636 |
0.07 |
0.57 |
|
V996629 |
579598 |
7415065 |
11.50 |
0.08 |
32.6 |
4.06 |
44.5 |
|
V996630 |
579596 |
7415046 |
0.52 |
0.27 |
280 |
0.04 |
0.42 |
|
V996631 |
579602 |
7415064 |
8.72 |
0.12 |
31.5 |
1.78 |
14.2 |
|
V996632 |
579599 |
7415060 |
1.09 |
0.79 |
1265 |
0.01 |
0.29 |
|
V996633 |
579574 |
7415251 |
9.98 |
0.31 |
205 |
0.13 |
0.29 |
|
V996634 |
579599 |
7415397 |
0.34 |
0.15 |
246 |
0.02 |
0.27 |
|
V996635 |
579629 |
7427824 |
1.22 |
0.62 |
791 |
0.14 |
1.02 |
|
V996636 |
579627 |
7427854 |
0.32 |
0.18 |
227 |
0.06 |
0.35 |
|
V996637 |
579634 |
7427901 |
0.39 |
0.12 |
317 |
0.03 |
0.08 |
Table # 4 - West Margin
|
Sample |
UTM E |
UTM N |
Cu % |
Ni % |
Co ppm |
Pt ppm |
Pd ppm |
|
V996671 |
578419 |
7408894 |
0.28 |
0.17 |
182 |
<0.01 |
0.16 |
|
V996672 |
578432 |
7408860 |
2.90 |
1.17 |
1095 |
<0.01 |
1.29 |
|
V996673 |
578430 |
7408823 |
1.39 |
0.51 |
460 |
0.37 |
1.73 |
|
V996674 |
578449 |
7408781 |
5.66 |
0.02 |
24.9 |
0.15 |
4.18 |
|
V996675 |
578462 |
7408736 |
0.79 |
0.81 |
828 |
0.05 |
0.33 |
|
V996676 |
578463 |
7408702 |
1.58 |
0.78 |
773 |
0.14 |
1.49 |
|
V996677 |
578523 |
7408483 |
1.17 |
0.05 |
36.8 |
0.02 |
1.24 |
|
V996678 |
578523 |
7408483 |
1.40 |
0.05 |
79 |
0.02 |
0.37 |
|
V996679 |
578529 |
7408464 |
0.16 |
0.11 |
240 |
0.02 |
0.18 |
|
V996680 |
578534 |
7408445 |
0.33 |
0.37 |
853 |
0.02 |
0.09 |
|
V996681 |
578567 |
7408407 |
1.64 |
0.88 |
1250 |
<0.01 |
0.48 |
|
V996682 |
578558 |
7408577 |
0.66 |
0.43 |
675 |
0.04 |
0.29 |
|
V996683 |
578547 |
7408288 |
0.94 |
0.31 |
344 |
<0.01 |
0.28 |
|
V996684 |
578643 |
7408072 |
1.63 |
0.82 |
805 |
<0.01 |
0.79 |
|
V996685 |
578738 |
7407643 |
0.60 |
0.02 |
21.5 |
<0.01 |
0.42 |
|
V996686 |
578638 |
7407922 |
0.65 |
0.51 |
657 |
0.03 |
0.26 |
Table # 5 Funnel Area
|
Sample |
UTM E |
UTM N |
Cu % |
Ni % |
Co ppm |
Pt ppm |
Pd ppm |
|
V996667 |
579844 |
7403324 |
0.75 |
0.44 |
496 |
0.01 |
0.16 |
|
V996668 |
579869 |
7403160 |
0.39 |
0.19 |
160 |
0.01 |
0.11 |
|
V996669 |
579869 |
7403157 |
0.40 |
0.16 |
124 |
0.01 |
0.16 |
|
V996670 |
579206 |
7403507 |
2.98 |
0.08 |
41.6 |
0.05 |
6.42 |
|
V996687 |
580395 |
7402059 |
0.48 |
0.23 |
293 |
0.02 |
0.25 |
|
V996688 |
580415 |
7402013 |
2.26 |
0.30 |
371 |
0.08 |
1.34 |
|
V996689 |
580492 |
7401836 |
0.19 |
0.09 |
159.5 |
0.01 |
0.14 |
|
V996690 |
580523 |
7401730 |
1.71 |
0.85 |
350 |
0.04 |
1.23 |
|
V996691 |
580563 |
7401562 |
0.26 |
0.04 |
35.6 |
0.04 |
0.34 |
|
V996692 |
580568 |
7401559 |
0.31 |
0.13 |
327 |
0.01 |
0.09 |
|
V996693 |
581514 |
7401871 |
0.28 |
0.11 |
106 |
0.02 |
0.28 |
|
V996694 |
581516 |
7401950 |
0.18 |
0.12 |
198.5 |
<0.01 |
0.1 |
|
V996695 |
581503 |
7401994 |
0.61 |
0.19 |
89.2 |
0.08 |
0.79 |
|
V996696 |
581517 |
7402045 |
1.32 |
0.37 |
193 |
0.11 |
0.64 |
|
V996697 |
581504 |
7402070 |
1.13 |
0.32 |
207 |
0.12 |
0.87 |
|
V996698 |
581498 |
7402217 |
0.31 |
0.07 |
48.1 |
0.04 |
0.31 |
|
V996699 |
581486 |
7402257 |
0.26 |
0.12 |
149.5 |
0.01 |
0.17 |
Table # 6 - South Pyrrhotite Lake
|
SAMPLE |
UTM E |
UTM N |
Cu % |
Ni % |
Co ppm |
Pt ppm |
Pd ppm |
|
V996656 |
580775 |
7406662 |
0.74 |
0.42 |
604 |
<0.01 |
0.15 |
|
V996657 |
580753 |
7406811 |
1.24 |
0.53 |
1050 |
0.01 |
0.2 |
|
V996658 |
580754 |
7406884 |
0.44 |
0.10 |
82 |
0.04 |
0.41 |
|
V996659 |
580795 |
7407094 |
0.64 |
0.45 |
664 |
0.04 |
0.33 |
|
V996660 |
580784 |
7407250 |
0.54 |
0.21 |
512 |
0.01 |
0.07 |
|
V996661 |
580781 |
7407318 |
0.34 |
0.11 |
285 |
<0.01 |
0.04 |
|
V996662 |
580786 |
7407393 |
0.23 |
0.10 |
192 |
0.01 |
0.06 |
|
V996663 |
580785 |
7407422 |
2.38 |
0.85 |
1440 |
0.01 |
0.68 |
|
V996664 |
580795 |
7407514 |
1.02 |
0.53 |
748 |
0.13 |
1.64 |
|
V996665 |
580783 |
7407530 |
0.61 |
0.44 |
590 |
0.02 |
0.29 |
|
V996666 |
580758 |
7407715 |
0.77 |
0.45 |
614 |
0.01 |
0.24 |
Table # 7 - East Pyrrhotite Lake
|
Sample |
UTM E |
UTM N |
Cu % |
Ni % |
Co ppm |
Pt ppm |
Pd ppm |
|
V996639 |
580642 |
7410489 |
1.85 |
1.72 |
2220 |
0.07 |
0.59 |
|
V996640 |
580725 |
7410219 |
1.13 |
0.03 |
27.5 |
0.17 |
1.22 |
|
V996641 |
580752 |
7410160 |
3.01 |
0.03 |
27 |
0.08 |
0.4 |
|
V996642 |
580756 |
7410137 |
0.09 |
0.05 |
75.9 |
<0.01 |
0.06 |
|
V996643 |
580755 |
7410120 |
0.45 |
0.14 |
90 |
0.05 |
0.49 |
|
V996644 |
580764 |
7410106 |
0.32 |
0.44 |
53.2 |
0.03 |
0.28 |
|
V996645 |
580786 |
7410020 |
0.39 |
0.48 |
39.7 |
0.02 |
0.14 |
Table # 8 - Val Area
|
Sample |
UTM E |
UTM N |
Cu % |
Ni % |
Co ppm |
Pt ppm |
Pd ppm |
|
V996646 |
580967 |
7405311 |
0.62 |
0.41 |
666 |
0.02 |
0.14 |
|
V996647 |
580966 |
7405299 |
0.54 |
0.32 |
392 |
0.02 |
0.21 |
|
V996648 |
580978 |
7405216 |
0.36 |
0.12 |
113.5 |
0.02 |
0.22 |
|
V996649 |
581018 |
7405172 |
1.09 |
0.16 |
147 |
0.15 |
1.22 |
|
V996650 |
580996 |
740933 |
0.11 |
0.03 |
133 |
0.01 |
0.03 |
|
V996651 |
581216 |
7404177 |
0.65 |
0.35 |
643 |
<0.01 |
0.08 |
|
V996652 |
581217 |
7404163 |
0.27 |
0.09 |
187.5 |
<0.01 |
0.05 |
|
V996653 |
581232 |
7404040 |
0.90 |
0.63 |
871 |
0.01 |
0.06 |
|
V996654 |
581237 |
7403967 |
0.71 |
0.60 |
1195 |
0.02 |
0.29 |
|
V996655 |
581254 |
7403801 |
1.33 |
0.32 |
308 |
0.11 |
0.6 |
Historic Exploration Drilling Programs
The companies’ project covers the southern exposure of the Proterozoic, Layered Muskox Ultramafic Intrusive (LMUI). The LMUI outcrops over 80 kilometers along strike and could be one of the largest layered, ultramafic complexes in the world based on regional airborne surveys. The region has received only sporadic, systematic exploration since its first discovery and exploration by Inco in the late 1950’s. Additional systematic exploration was not conducted again until the 1980’s and in 1999 to 2007. Several rounds of geochemical, geophysical, geological mapping and limited diamond drilling have been undertaken on the property. These studies have been able to define at least two sulphide pulses associated with the emplacement of the LMUI. These pulses both contain high nickel and copper concentrations with associated precious metals (see November 12, 2020 news release).
Stratiform, layered mineralization is known to occur in one of the early pulses of magma from the ultramafic, layered intrusive complex. Mineralization in the form of pyrrhotite, pentlandite, chalcopyrite are the more common minerals observed. Concentrations of Copper, Nickel, Platinum, Palladium, and Cobalt occur within this horizon that extends for over 40 kilometres. Key evidence and similarities to Norilsk indicate the massive sulphide mineralization is a later event than the disseminated mineralization at McGregor Lake and the mineralization appears to be occurring in near vertical structures. Exploration of the massive sulphides in previous drilling programs on the property has been predominantly vertical holes, therefore difficult to properly evaluate.
Remobilized mineralization is also present and might have occurred due to the emplacement of later Proterozoic diabase dykes. Below in Table # 9 are some of the more significant, historical precious metal assay results from surface rock sampling. Exceptionally high, precious metals values for primary layered intrusive style mineralization. Previous exploration programs focused on primary mineralization, with no consideration towards secondary remobilization and precious metal enrichments along known, steeply dipping structures.
Table # 9 Historical Assays
|
Pd |
Pt |
Au |
Length |
|
g/tonne |
g/tonne |
g/tonne |
Metres |
|
126.59 |
11.52 |
5.6 |
0.76 |
|
28.3 |
3.11 |
1.24 |
0.21 |
|
74.96 |
4.04 |
4.35 |
0.55 |
|
16.8 |
1.84 |
0.62 |
0.66 |
|
90.82 |
6.84 |
5.6 |
0.21 |
|
134.99 |
9.02 |
5.91 |
0.37 |
Quality Assurance/Quality Control Rock Samples
All rock samples were collected by professional geoscientists. Samples were placed in plastic sample bags with samples tags placed in each bag before being sealed. Samples were transported to the field camp site and later to the ALS sample preparation facility in Yellowknife under the supervision of a professional geoscientist. The Yellowknife sample preparation laboratory crushed and pulverized samples then used a riffle splitter to obtain up to 85 per cent of a 250-gram sample passing through 75-micrometre screen. The pulverized samples were then securely transported to their laboratory in Vancouver and analyzed using procedure ME MS41 (ultra trace aqua regia ICP-MS (inductively coupled plasma mass spectrometry)) followed by a four acid digestion procedure (ME-062 ICP-AES for ore grade elements and finally an Ni-OG62 procedure for higher grade nickel.
Lorne Warner, P.Geo, is a qualified person as defined by National Instrument 43-101 and has reviewed and approved the scientific and technical disclosure in this news release.
On behalf of the Board of Directors
“Harold Forzley” CEO Bathurst Metals Corp.
For more information contact Harold Forzley, CEO
hardy@bathurstmetals.com
Neither TSX Venture Exchange nor its regulation services provider (as that term is defined in the policies of the TSX Venture Exchange) accepts responsibility for the adequacy or accuracy of this release.
Certain of the statements made and information contained herein may contain forward- looking information within the meaning of applicable Canadian securities laws. Forward-looking information includes, but is not limited to, information concerning the Company's intentions with respect to the development of its mineral properties. Forward-looking information is based on the views, opinions, intentions and estimates of management at the date the information is made, and is based on a number of assumptions and subject to a variety of risks and uncertainties and other factors that could cause actual events or results to differ materially from those anticipated or projected in the forward-looking information (including the actions of other parties who have agreed to do certain things and the approval of certain regulatory bodies). Many of these assumptions are based on factors and events that are not within the control of the Company and there is no assurance they will prove to be correct. There can be no assurance that forward-looking information will prove to be accurate, as actual results and future events could differ materially from those anticipated in such information. The Company undertakes no obligation to update forward-looking information if circumstances or management's estimates or opinions should change except as required by applicable securities laws, or to comment on analyses, expectations or statements made by third parties in respect of the Company, its financial or operating results or its securities. The reader is cautioned not to place undue reliance on forward-looking information.
665 DOUGALL ROAD, GIBSONS, BC, V0N 1V8 WWW.BATHURSTMETALS.COM